Adikteev's free monthly Churn Scorecard lets you assess how your users interact with your app and when they might stop using it.
How these buckets can affect your app's revenue:
- User Churn Probability Buckets: See how likely different groups of users are to stop using the app.
- Revenue Impact: Measure the potential revenue loss associated with these churn buckets in the next 30 days
IN SYNC WITH YOUR RETENTION STRATEGY
![]()
GROW YOUR RETARGETING LISTS & SCALE CAMPAIGNS
Create lists of about-to-churn users with high revenue impact
![]()
ENHANCE CRM & PUSH STRATEGIES
Integrate high-value user segments into other re-engagement campaigns
![]()
IMPROVED BUDGET DISTRIBUTION
Focus on users who are likely to churn and never waste resources on organic activity.
![]()
MEASURABLE REVENUE IMPACT
Assess how much revenue you might lose when users leave.

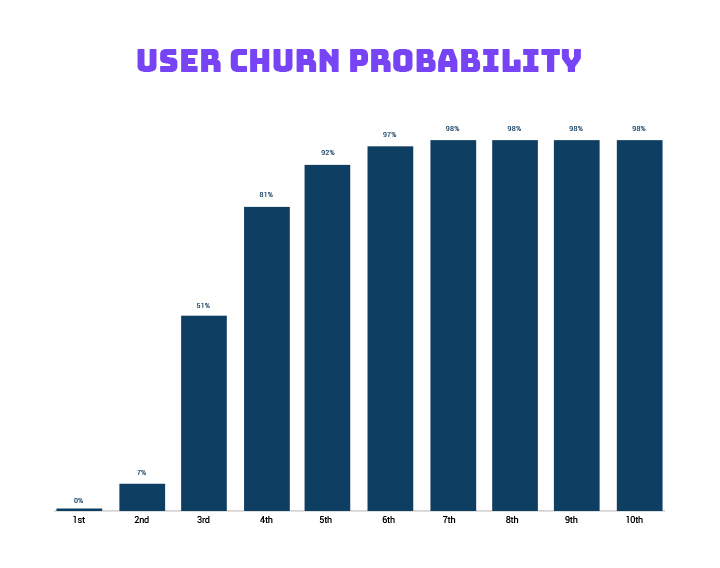
This is the percentage of users not returning to the app in the next 7 days. They're segmented based on their churn likelihood.
Users are classified into ten groups based on their churn score. Each group shows the percentage of users predicted not to return to the app. Group 1 is the most likely to return and group 10 is the least likely.
The analysis scores all users who were active in the last 90 days before the scoring date.
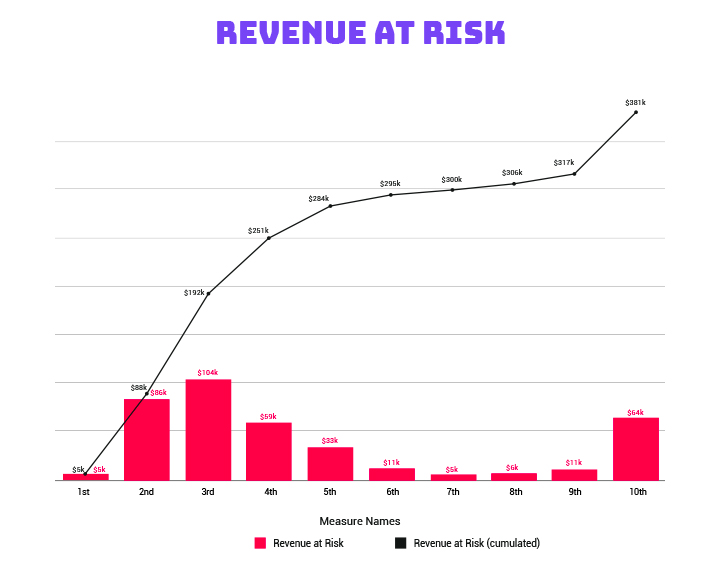
This represents potential lost revenue from users who might leave in the next 30 days, categorized into ten groups by churn likelihood. The higher the group score, the greater the revenue risk. It's calculated by multiplying pre-ranking revenue by churn percentage. Understanding these high-risk groups allows for prioritizing retention efforts, re-engagement strategies, or revenue adjustments based on user behavior.
OUR MODEL'S ACCURACY
What's your Churn prevention strategy?
Combining inactivity windows with Churn Prediction lets you identify users who may leave your app in greater detail.
Inactivity windows & churn prediction
Churn Prediction complements inactivity windows by identifying users who may not return in more detail. By using both methods, you can better understand who might stop using the app and when to reach out to them. Churn Prediction also offers insights beyond a simple binary approach like inactivity windows. For example, it can highlight users who are at risk of leaving, even if they've been active within the last 7 days. This prevents active-looking users from slipping through the cracks. Additionally, it helps optimize engagement strategies without overshadowing the importance of UA metrics. By combining both methods, you can fine-tune your targeting, potentially finding that a shorter inactivity period, like 5 days, might work better than 7 days.
